Since participating in the initial pilot of the OECD Test for Schools (based on PISA) in the United States, and for every year since, BASIS.ed students taking the OECD exam showed that if the BASIS.ed network of schools was a country, it would be the top-performing nation in the world. That is, BASIS.ed students have outperformed the best school systems on earth in the 2012 OECD pilot, and then in 2014, 2015, and now 2016.
Eight BASIS.ed schools were eligible to take the OECD exam in 2016: BASIS Chandler, BASIS Flagstaff, BASIS Oro Valley, BASIS Peoria, BASIS Phoenix, BASIS Scottsdale, BASIS Independent Silicon Valley, and BASIS Tucson North. Once again, the BASIS.ed network’s performance ranked above Shanghai, China, the nation with the best scores in the world. The average BASIS.ed student also scored substantially above their average American peer taking the exam.
The OECD Test for Schools (based on PISA) is a student assessment tool geared for use by schools and networks of schools to support research, benchmarking, and school improvement efforts. The assessment tool provides descriptive information and analyses on the skills and creative application of knowledge of 15-year-old students in reading, mathematics, and science.
That is, the exam measures how students apply the reading knowledge, math knowledge, and science knowledge that they have learned in school to solve problems that they may encounter in the real world.
Further, schools, districts, and networks that take the OECD exam are given thorough and detailed results – with data that helps to suggest and catalyze strategies to Improve areas that are lacking.
“That ‘creative application of knowledge’ part is the most important description of this exam,” said BASIS.ed CEO Peter Bezanson. “It’s not a typical assessment. It doesn’t measure facts and answers. It measures learning, and concepts, and – most vitally – how students apply the knowledge they have to solve problems and answer questions. That’s precisely what our academic program has proven it is able to do!”
Half a million 15-year-olds across the world take the OECD or PISA exam — representing 28 million students in 65 countries.
Also of note in BASIS.ed’s results:
- All 8 BASIS.ed schools scored in the top 1% of schools in the U.S. in all categories (math, reading, and science).
- All 8 BASIS.ed schools scored in the top 3% of schools in the world in all categories (math, reading, science).
- BASIS.ed students outscored students in every other educational system, including students in Shanghai, the world’s top performing system.
- BASIS.ed students outscored U.S. Private School students.
- When compared to their American peers, BASIS.ed students are:
- Six times more likely to score in the highest performance levels in math;
- Five times more likely in reading; and
- Nearly five times more likely in science.
- BASIS charter school students are not only some of the highest performing kids in the world, they are also more satisfied with their teachers than students in nearly every other educational system.
OECD Test for Schools (based on PISA) 2016 Mean Scores
Math:
648 – BASIS Chandler
641 – BASIS Independent Silicon Valley
639 – BASIS Scottsdale
627 – BASIS Phoenix
626 – BASIS.ed Schools
621 – BASIS Flagstaff
619 – BASIS Tucson North
613 – Shanghai (2012 PISA)
609 – BASIS Oro Valley
605 – BASIS Peoria
496 – U.S. Private (2012 PISA)
481 – U.S. (2012 PISA)
Reading:
620 – BASIS Scottsdale
611 – BASIS Phoenix
610 – BASIS Peoria
609 – BASIS.ed Schools
609 – BASIS Chandler
609 – BASIS Flagstaff
609 – BASIS Tucson North
607 – BASIS Oro Valley
596 – BASIS Independent Silicon Valley
570 – Shanghai (2012 PISA)
527 – U.S. Private (2012 PISA)
498 – U.S. (2012 PISA)
Science:
617 – BASIS Chandler
616 – BASIS Independent Silicon Valley
615 – BASIS Tucson North
613 – BASIS Flagstaff
612 – BASIS Peoria
611 – BASIS.ed Schools
610 – BASIS Scottsdale
606 – BASIS Oro Valley
602 – BASIS Phoenix
580 – Shanghai (2012 PISA)
519 – U.S. Private (2012 PISA)
497 – U.S. (2012 PISA)
* Average of scores for all eight BASIS.ed schools participating.
** The 2016 OECD Test for Schools is benchmarked to the 2012 PISA results.
Please click on the charts below to enlarge your view.
Average Score in Math, Science and Reading
![]() BASIS.ed students outscored students in every other educational system according to results from the 2016 OECD Test for Schools (based on PISA), including students in Shanghai, the world’s top performing system.
BASIS.ed students outscored students in every other educational system according to results from the 2016 OECD Test for Schools (based on PISA), including students in Shanghai, the world’s top performing system.
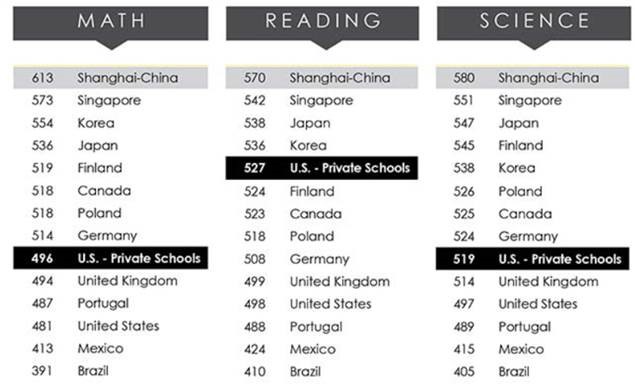 BASIS.ed students even outscored U.S. Private School students according to results from the 2016 OECD Test for Schools (based on PISA).
Percent of Students Scoring in the Top Performance Levels
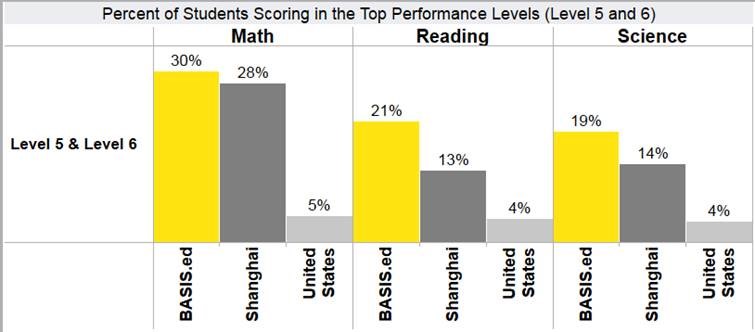 BASIS.ed students are also more likely to score in the top performance levels than students in any other educational system. When compared to their American peers, BASIS.ed students are six times more likely to score in the highest performance levels in Math, five times more likely in Reading and nearly five times more likely in Science. Students “..who get to Level 5 or above can be regarded as potential ‘world-class’ knowledge workers of tomorrow’ according to the 2015 OECD Test for Schools report.
Average Student-Teacher Relations Score
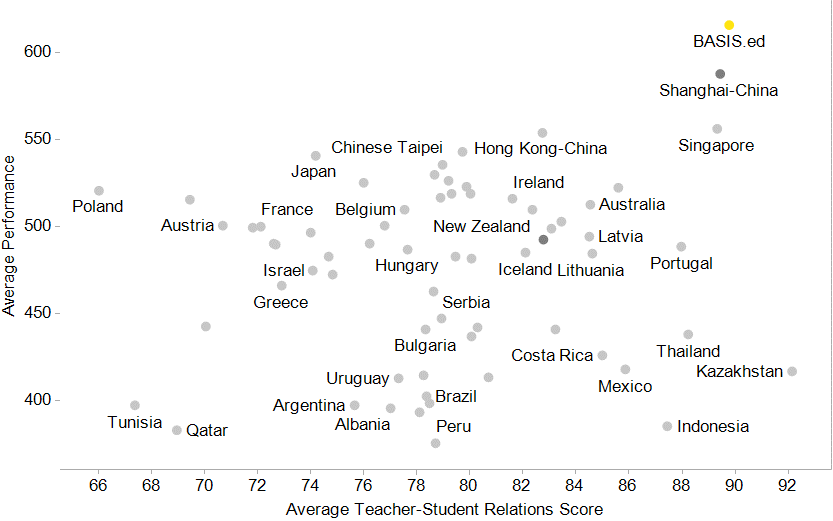 BASIS charter school students are not only some of the highest performing kids in the world, they are also more satisfied with their teachers than students in nearly every other educational system!

- More National Rankings Domination for BASIS Curriculum Schools: The Washington Post 4 BASIS charters included in the ‘Public Elites’; 3 in the Top 10, including #1 school in U.S. - May 5, 2017
- NEW RANKINGS: 5 BASIS Curriculum Schools in Nation’s Top 10 That's no typo: our network boasts the #1, #2, #3, #5, & #7 public high schools - April 25, 2017
- BASIS Curriculum Schools Are Disruptive - April 25, 2017
- BASIS.ed Remains Bright Spot in International Assessment U.S. Declines in Math, Stagnates in Reading and Science - December 8, 2016
- Photogenic An Artistic and Academic Accomplice - October 3, 2016
- OECD Scores Soar Again International Benchmarks Beget Internationally Elite Results - September 16, 2016
- The Founders’ Prize for Senior Project Excellence, 2016 Our Inaugural Winners: 2 Dynamic Duos - September 4, 2016
- BASIS.ed Teacher Wins White House Award It’s Often Called 'the Nation's Highest Teaching Honor' - August 23, 2016
- Six BASIS.ed World Travelers From Shenzhen, to Bangkok, to New Haven - August 2, 2016
- Learning Transcends Bricks and Mortar A New Schoolhouse for BASIS Scottsdale - August 1, 2016
Thanks for sharing this! Both my kids are at BASIS, so this info is good to know. Comparing against averages may yield a lot of biases, since we know that there is too wide of a spectrum in the “US Private Schools” category.. How does BASIS compare to some of the top schools in the SF Bay Area, such as Harker, Bellarmine, St Francis, etc?
Can you explain more why Basis school 2016 results are bench marked against other school’s 2012 results?? How is the analysis constructed to make this a meaningful comparison? How does the results look if you only look at 2016 results for all the schools?
There are two different tests. Schools like the students at BASIS Curriculum Schools take the “OECD Test for Schools (based on PISA)”. The IECD Test for Schools is given every spring.
In contrast, ENTIRE NATIONS take the PISA exam – and that exam is only administered every three years: 2009, 2012, and 2015, and next in 2018. The latest PISA results, for the 2015 PISA Exam, were just released in December 2016.
Every OECD Test for Schools is “benchmarked” against one PISA exam. Because the 2015 PISA Exam results were not released until December 2016, all results from the OECD Test for Schools that was administered in the winter and spring of 2016 were based on the 2012 PISA Exam. Specifically, 2012 PISA Exam results were the latest ‘benchmarkable’ results available when the 2016 OECD Test for Schools exam was written!
In fact, even this spring’s 2017 OECD Test for Schools (based on PISA) results will be benchmarked against 2012 PISA Exam — because when the 2017 OECD Test for Schools was written — well, yes, once again, 2012 PISA Exam results were also the latest available!
The exams are similar; there aren’t huge differences. The benchmarking simply means the actual exam is a more-direct comparison of schools vs nations, which is what you’re comparing when you measure the exam given to individual schools and networks — the OECD Test for Schools (based on PISA) — with the exam given to entire nations — the PISA Exam.
Confusing, we realize! But that’s the reason for the very specific benchmarked data.